HR Management Analytics
Structuring an open-ended HR dataset into a ten-section analytics experience
Given a broad HR dataset without a predefined analytical brief, define what’s actually worth asking, structure the analysis around it, and build a complete interactive dashboard end to end.
No brief, just a broad dataset
This is a self-directed portfolio project, not a client engagement. The underlying data is a publicly available HR dataset used for portfolio and analytical demonstration purposes — 311 employee records across 43 fields covering demographics, employment status, performance, compensation, attendance, and termination. The working data lives in Google Sheets; the dashboard is built in Looker Studio.
The point of the project wasn’t to turn a dataset into charts. It was to practice the part that’s easy to skip: deciding what’s actually worth asking of HR data like this, organizing those questions into a coherent structure, and building the interactive experience around that structure.
The questions came first
Before building anything, the questions came first — for each area of the data, what would someone actually need to know? Examples of the questions the analysis was built to answer:
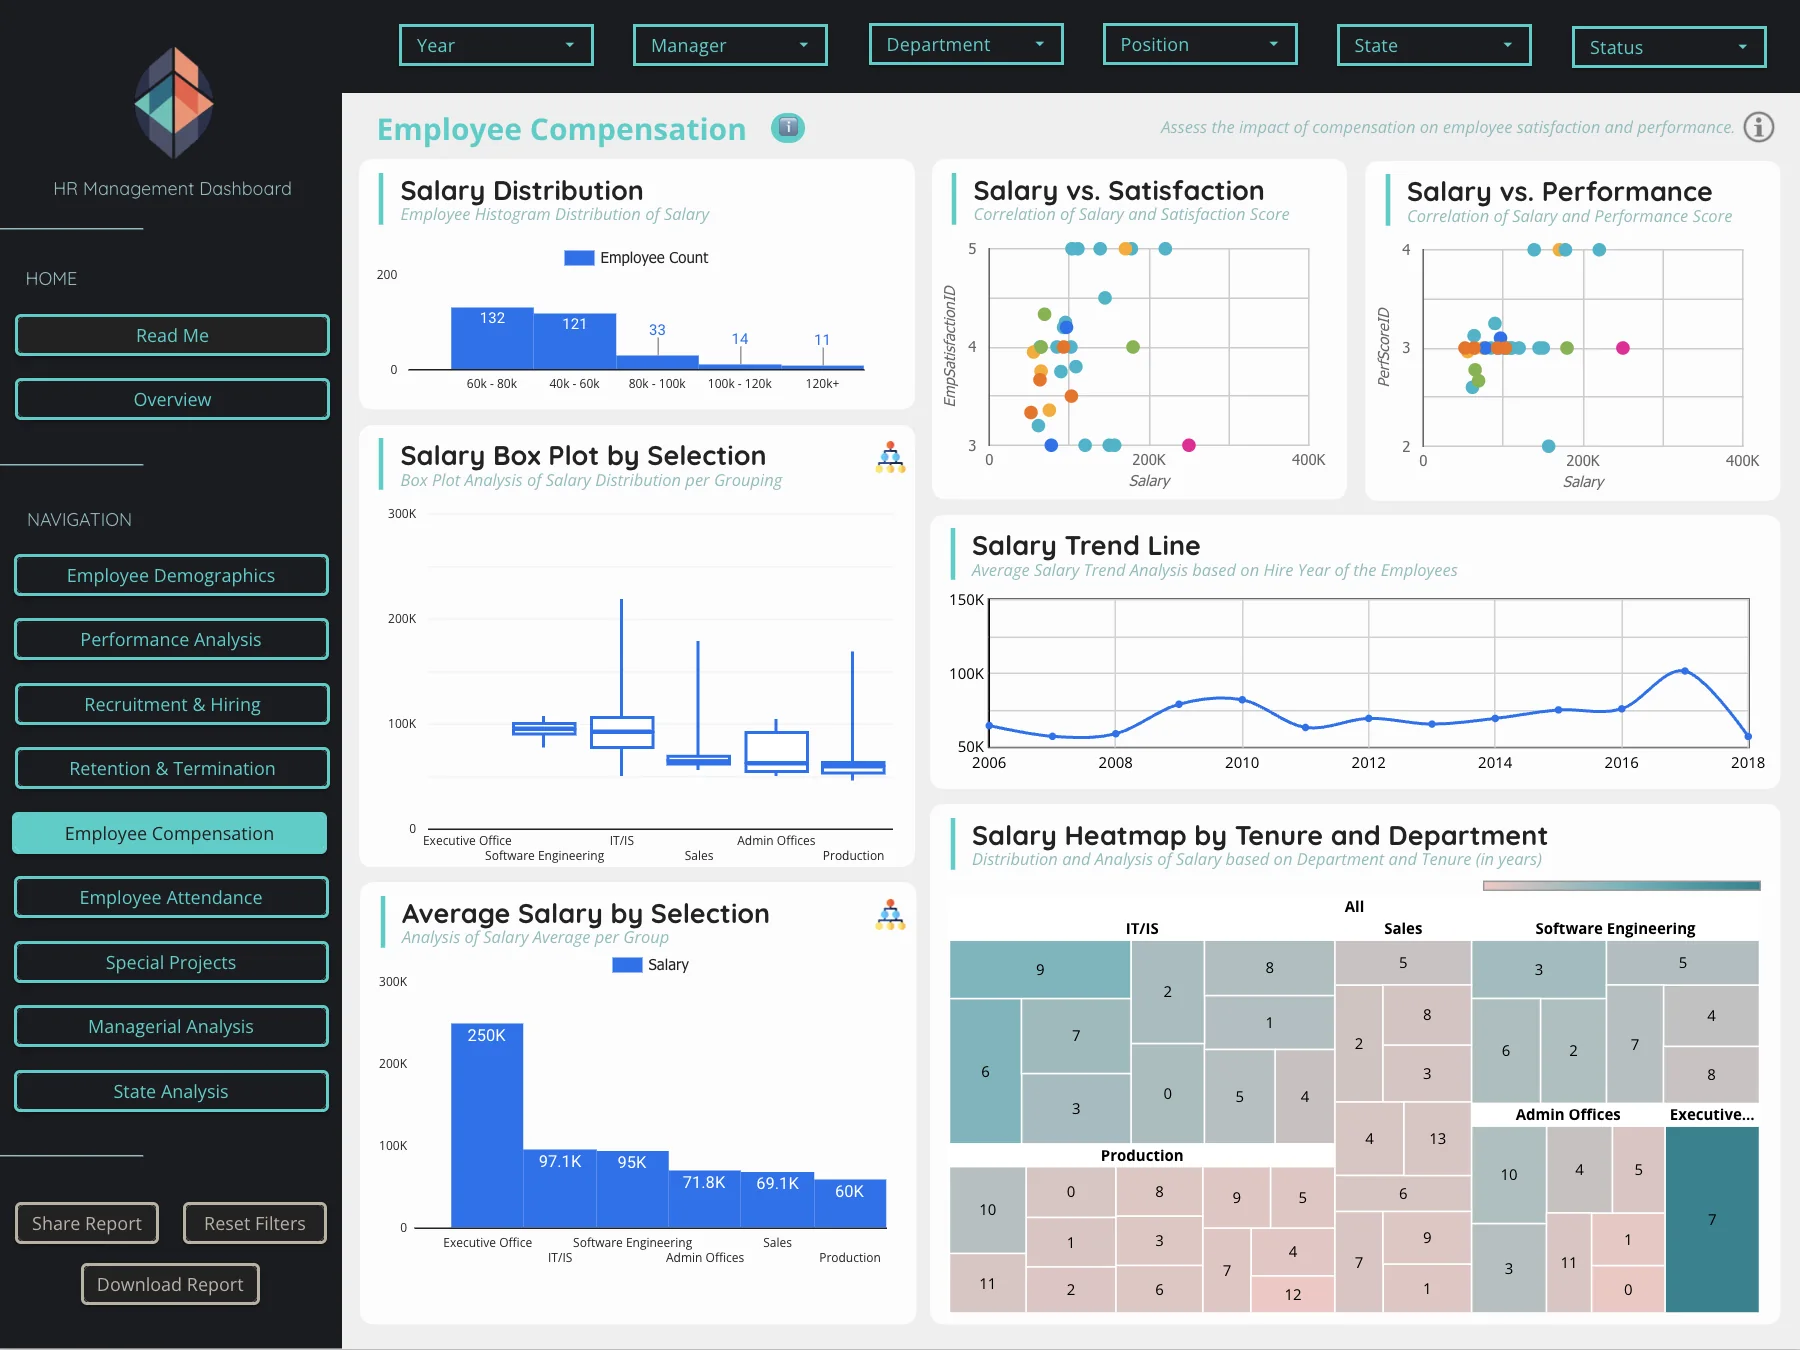
How does salary vary across departments and positions, and how does it relate to performance?
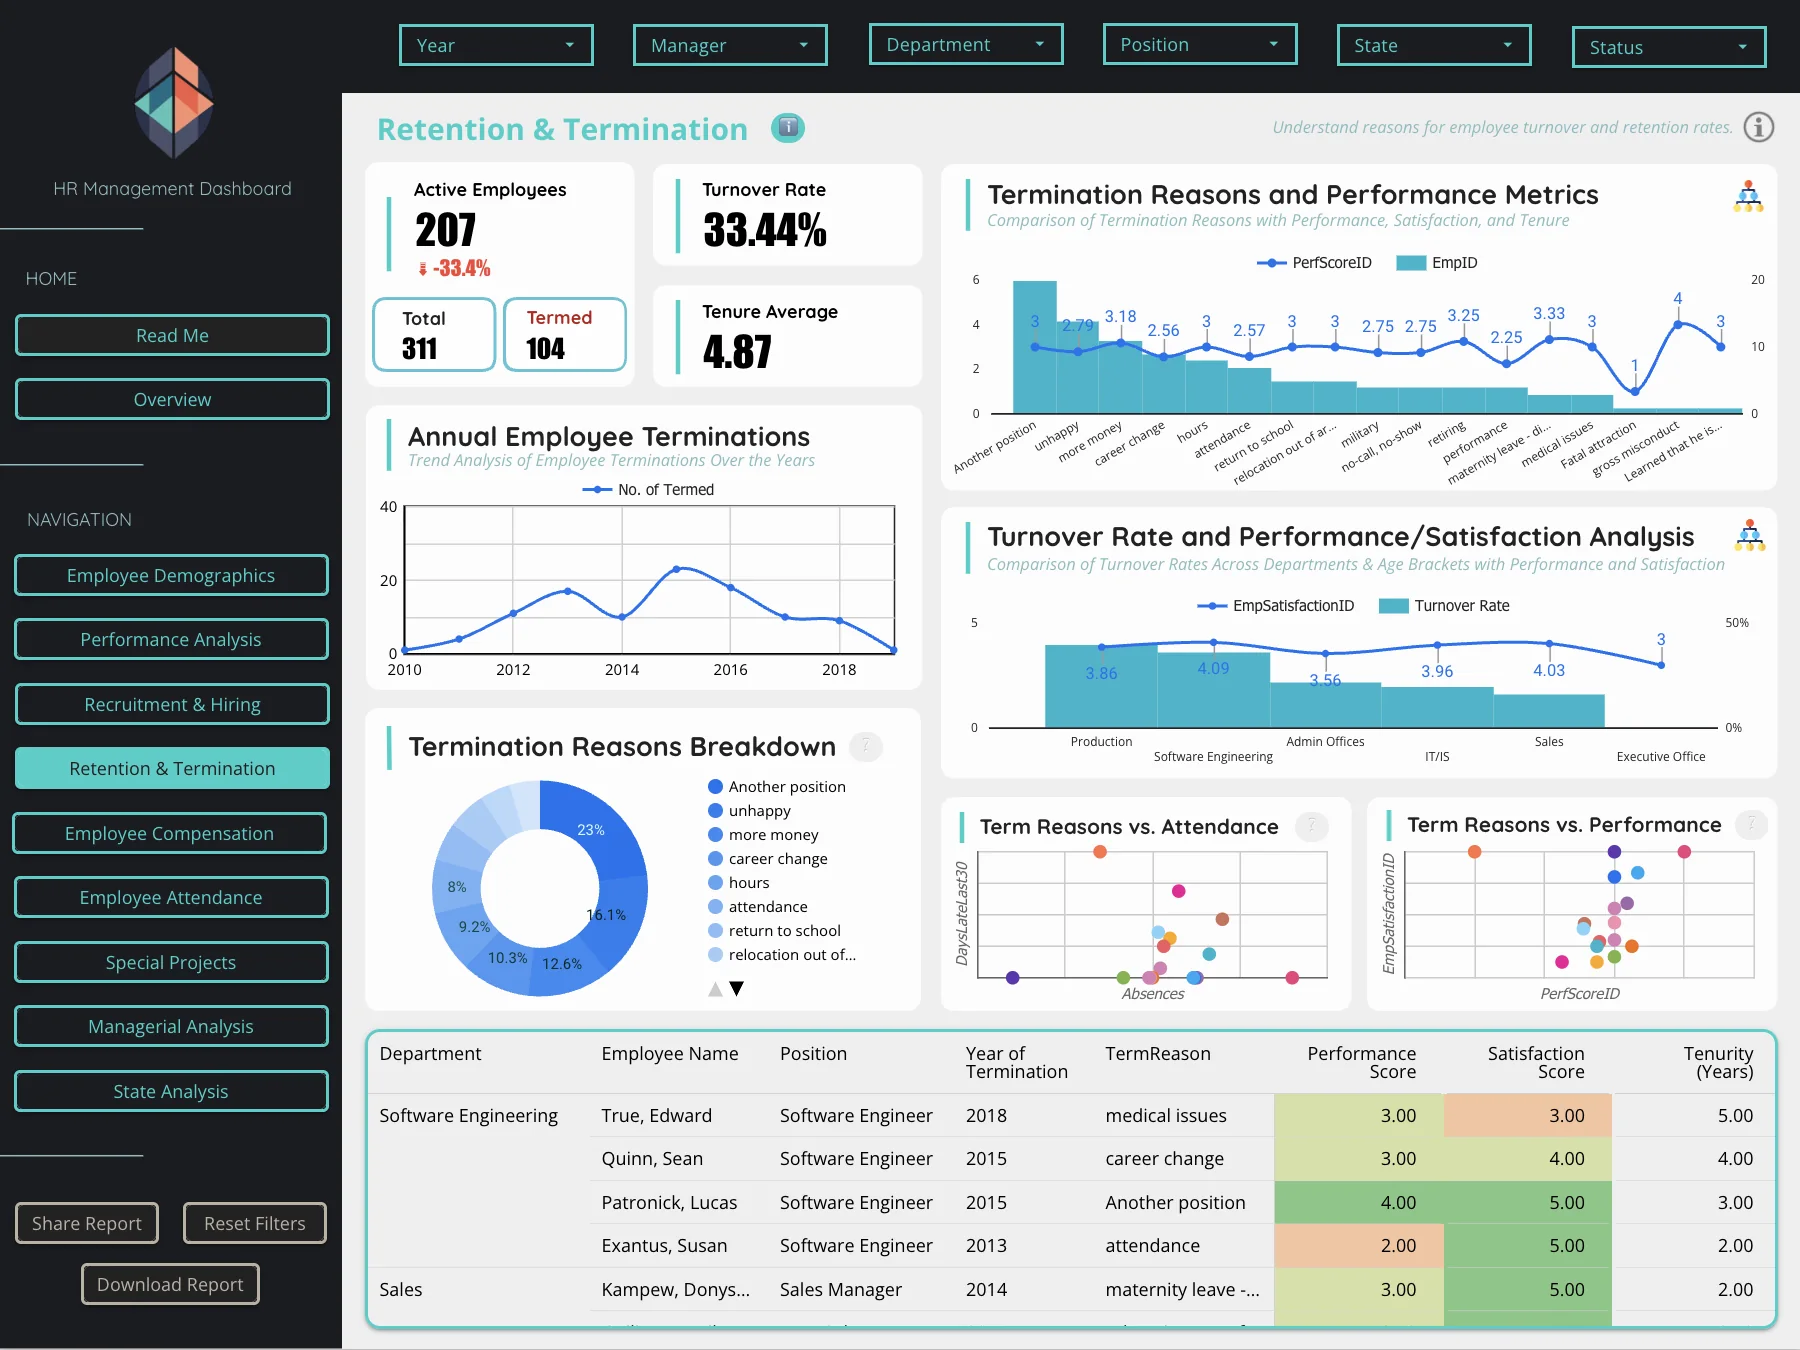
What are the main reasons employees leave, and how does tenure differ depending on the reason?
Which recruitment sources tend to produce employees who stay longer or score higher on satisfaction?
How does engagement relate to performance across departments?
How do headcount, performance, and compensation vary by state?
Each question was assigned to a section before a single chart was built, and each chart was chosen specifically to answer one of them.
Fields engineered for the questions
The raw dataset needed real preparation before it could answer the questions above. Several of the fields used throughout the dashboard aren’t in the original data — they were engineered in, each added specifically because a planned chart needed to compare across that dimension rather than a raw date. Categorical fields were checked for consistency before being connected to the report layer.
Ten sections, each with a purpose
Ten sections, each scoped around a defined purpose:
Two additional sections — employee engagement/feedback and a learning-and-development view — were scoped during planning and deliberately left out of the final build.
Three sections, three kinds of question
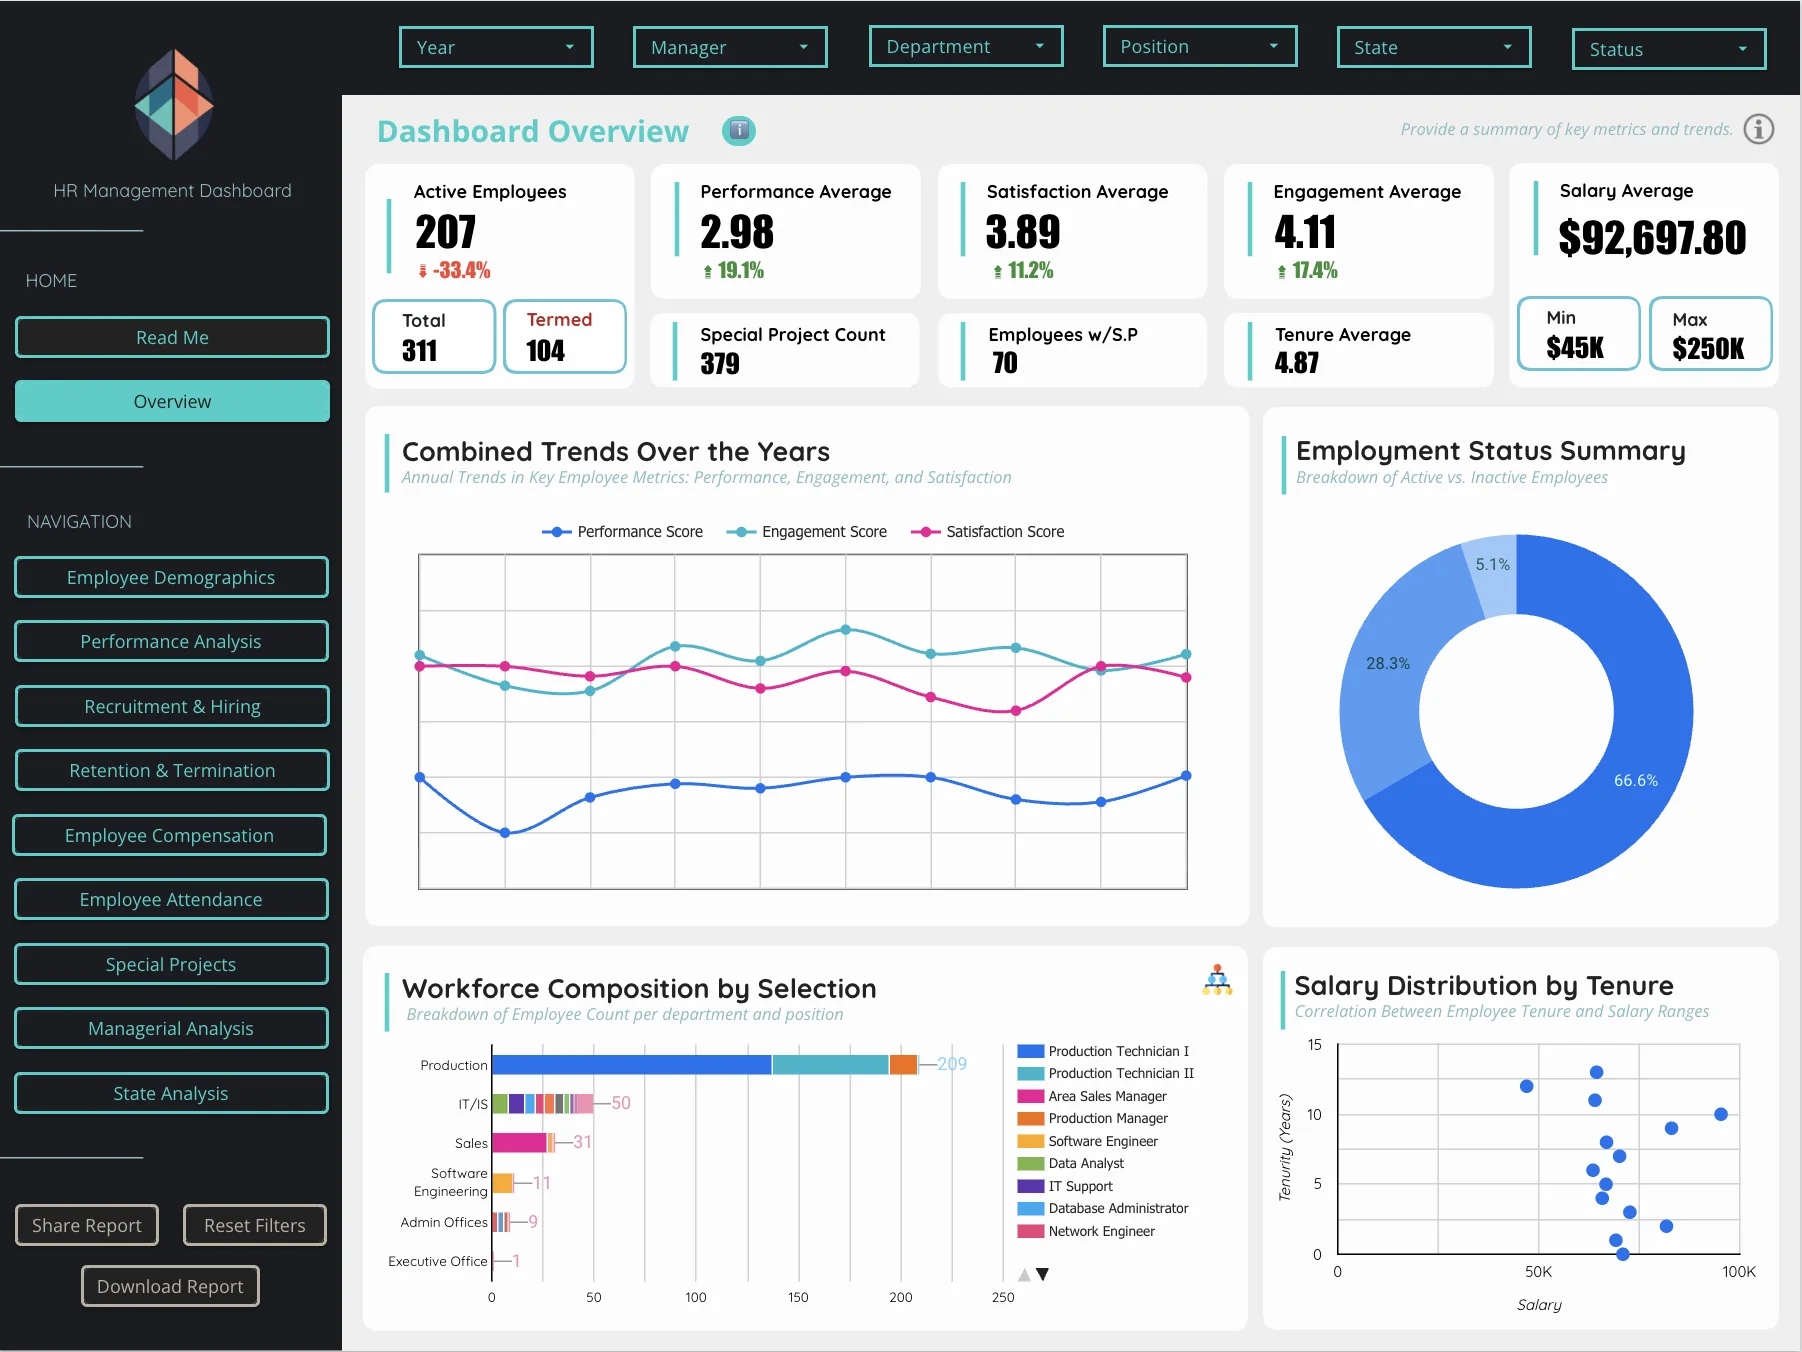
Three of the ten sections, chosen to show the range of the analysis.
The chart type follows the question
The dashboard supports filtering by department, position, manager, and other dimensions; drill-down on the Overview’s workforce composition chart (department → age bracket → position); hover tooltips on charts and scorecards; sortable, filterable detail tables; a reset-filters control; and report sharing/download. Interactivity was scoped per chart rather than applied uniformly — drill-down was added specifically where deeper exploration made sense, not everywhere by default.
The visual system was defined deliberately rather than left at tool defaults: Quicksand for scorecard text and section titles, Impact for the large scorecard numbers, Open Sans for subtitles, Roboto for chart labels, and a consistent teal accent color throughout.
Chart type followed the question in every section: bar charts for comparing categories, line charts for trends over time, scatter plots where the analysis called for exploring relationships between variables — such as salary and performance, or engagement and performance — pie charts for part-of-whole breakdowns, and a geo heatmap for the state-level view.
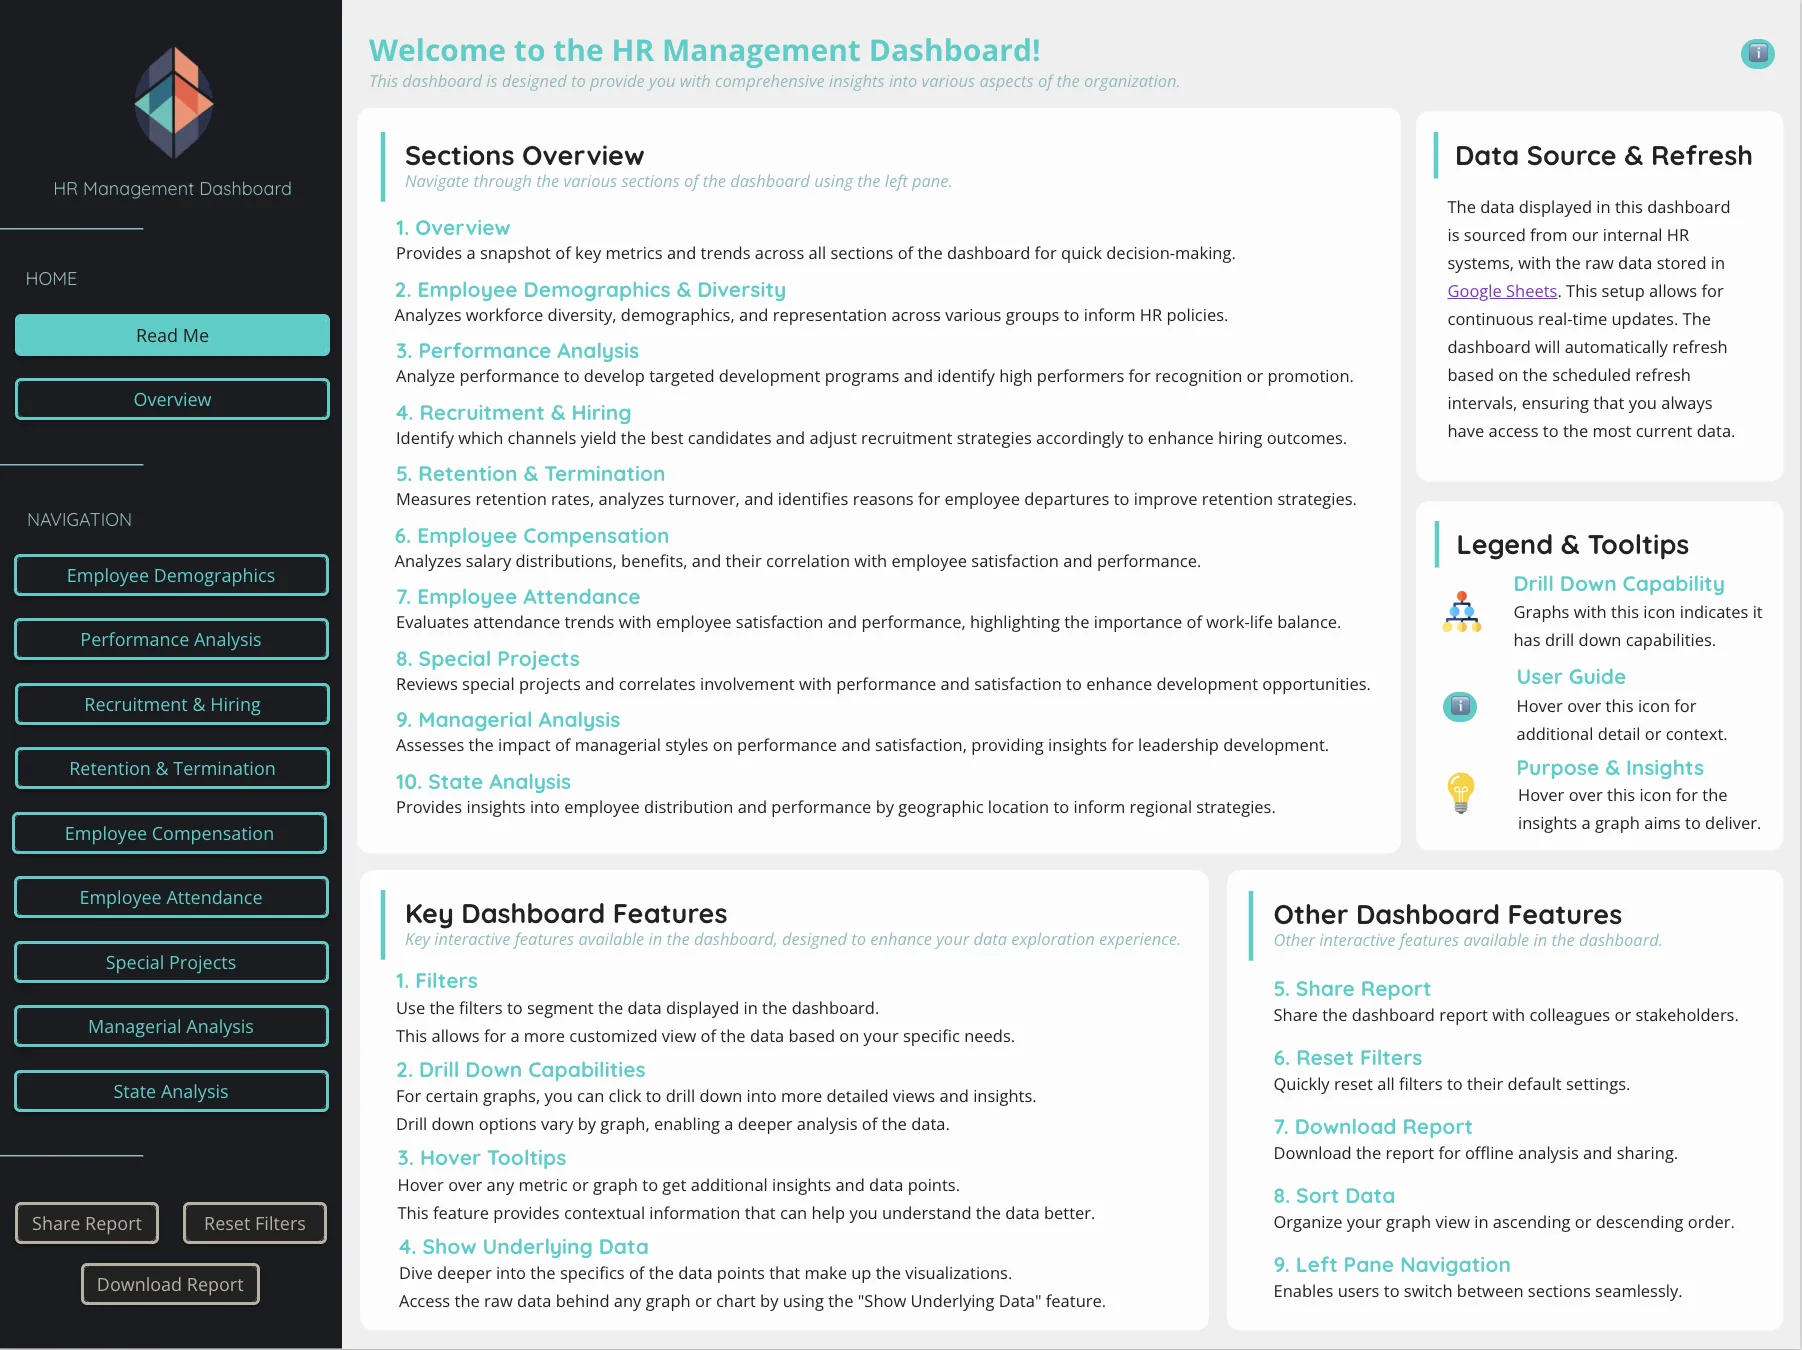
Filters, drill-downs, and tooltips are all live in the full report.
Open the live dashboardWhat this data can and can’t say
The dataset represents a single historical snapshot rather than a live, continuously updating HR system.
It’s heavily concentrated in one state (276 of 311 employees in Massachusetts), which limits how meaningful the State Analysis section is on this particular data, even though the capability is built and would apply directly to a more geographically distributed dataset.
Google Sheets is the sole data source, updated manually — there’s no live HRIS integration.
Two additional sections considered during planning were scoped out of the final build.
Questions, structure, data and build
I defined the analytical questions, structured the ten-section architecture around them, prepared the working dataset, designed the visual and chart-type system, and built the complete interactive report in Looker Studio, independently and end to end.
Key takeaways
- Can scope an open-ended analytics problem — deciding what’s worth asking — not just execute a fixed spec
- Chooses chart types deliberately based on the question being asked, not by default
- Treats structure and documentation as part of the build, not an afterthought
Explore it yourself.
Filters, drill-downs, and tooltips are all live in the full report.