Business intelligence & reporting automation

I turn fragmented business data into clarity.

I build automated management reporting systems that connect accounting, CRM and operational data into one reliable view, so the business stops rebuilding reports by hand.

01Source systemsXERO · XPM · FYI · CRM · EXCEL02IntegrationPOWER QUERY · SQL · REST APIS03Data modelSHARED DEFINITIONS04ReportingEXECUTIVE · OPERATIONAL · FINANCIAL05Decisions
Fig. 1: the shape of the systems I build.
Fig. 2 · Inside the model

One system, five stages

The model above, opened up. Each layer is built once and reused, so every report draws on the same definitions and the decisions at the end can be trusted.

Accounting, practice management, CRM and spreadsheet data flow through an integration layer into one layered data model, out to executive, operational and financial reporting, and on to the decisions that need attention.AccountingXEROPractice managementXPM · FYICRMPIPELINESpreadsheetsEXCEL · SHAREPOINTIntegrationPOWER QUERYSQLREST APISVALIDATION CHECKSExecutivePARTNER VIEWOperationalJOBS · WORKLOADFinancialTARGETS · BILLINGWhat needs attention01Financial performance02Operational exceptions03Team workload04Client responsivenessData modelSHARED DEFINITIONS
  1. 01
    Source systemsXero, XPM, FYI, CRM, Excel
  2. 02
    IntegrationPower Query, SQL, REST APIs, validation
  3. 03
    Data modelShared definitions
  4. 04
    ReportingExecutive, operational, financial
  5. 05
    DecisionsFinancial performance, operational exceptions, workload, client responsiveness
Fig. 1–2The shape of the systems I build: data the business already has, connected once and reported consistently.
Selected work

Connected reporting systems, not one-off dashboards

One client system in production, and two independent projects that show how I approach a problem from scratch.

Client work · Production system

One reporting system across thirteen dashboards

Accounting & advisory firm, Australia

I designed and delivered a reporting ecosystem spanning thirteen Power BI dashboards, using shared architectural patterns and reusable components across accounting, practice management and operational data.

13 dashboards, one connected architectureFYI · Xero · XPM · SharePointRefreshes three times a day
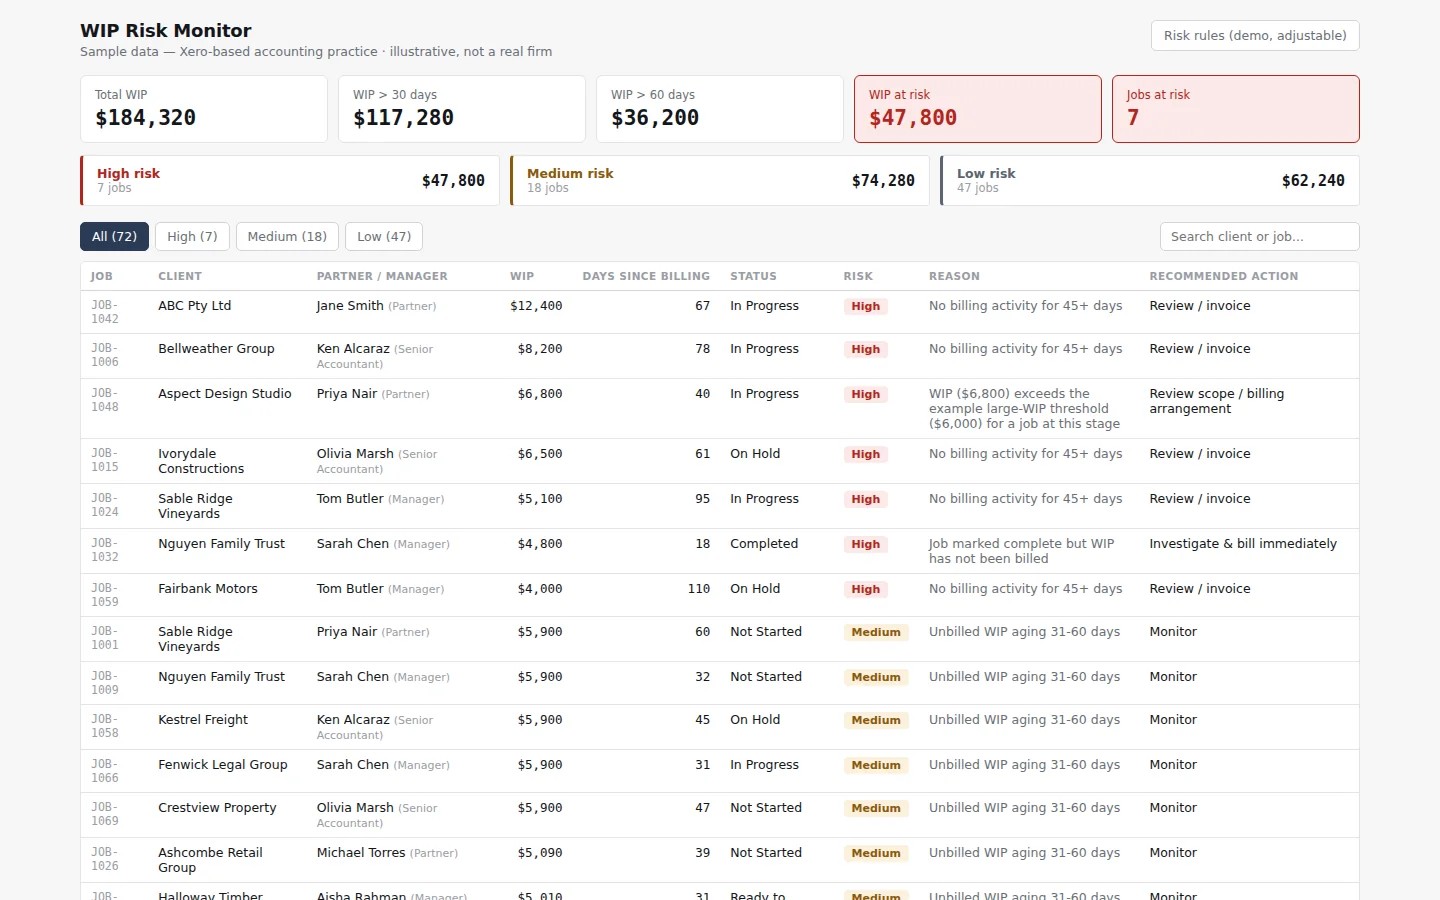
WIP RISK MONITOR · OVERVIEW
WIP Risk Monitor overview with KPIs and the ranked job table
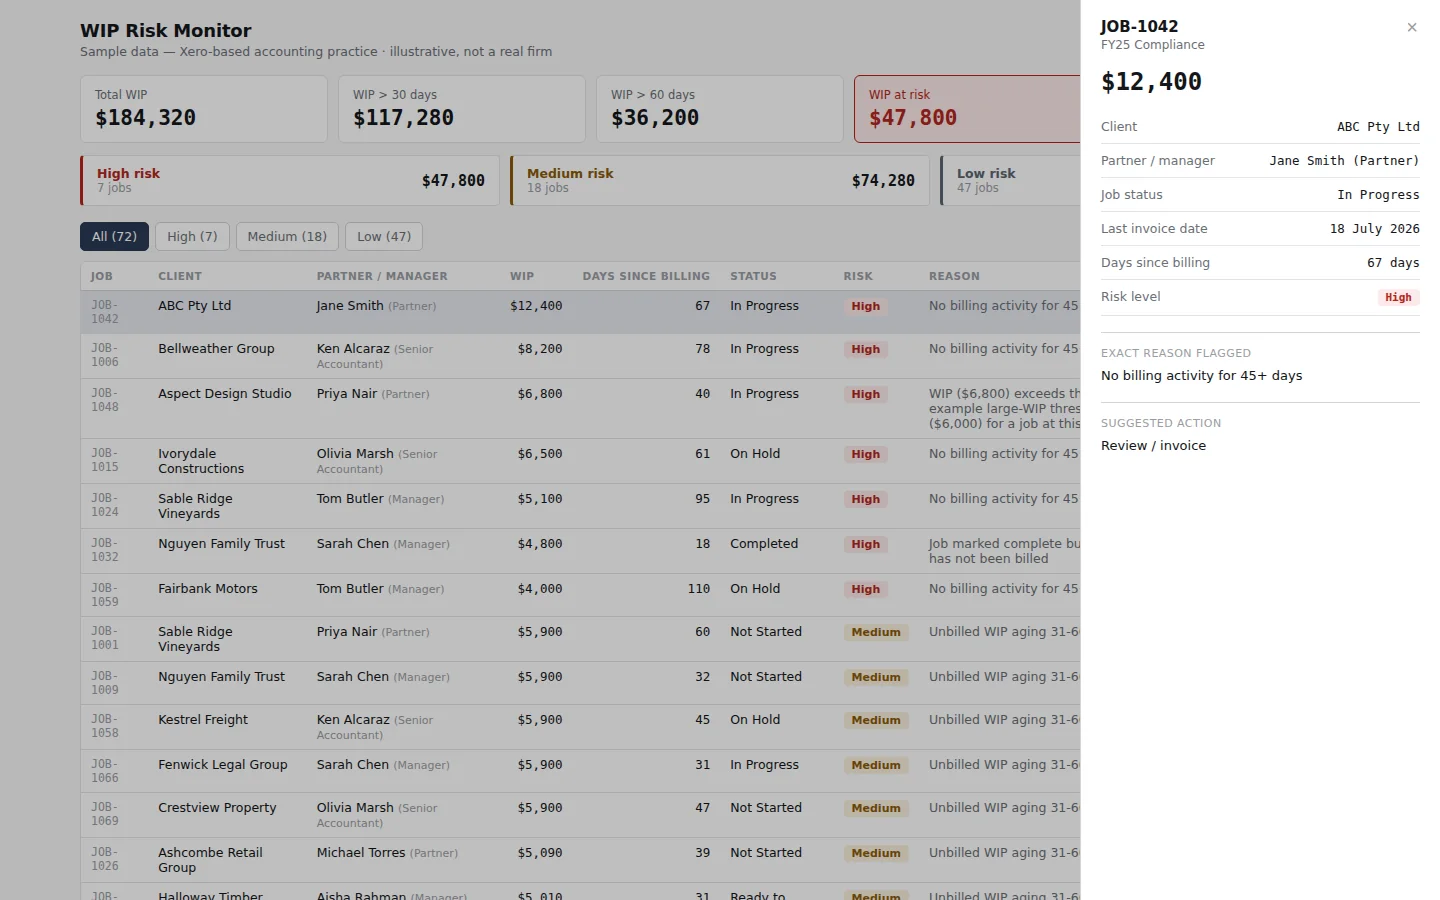
JOB DETAIL
Independent prototype · Sample data

WIP Risk Monitor

Turning unbilled work into an actionable risk queue: which jobs need attention first, and why. Built on 72 fictional jobs.

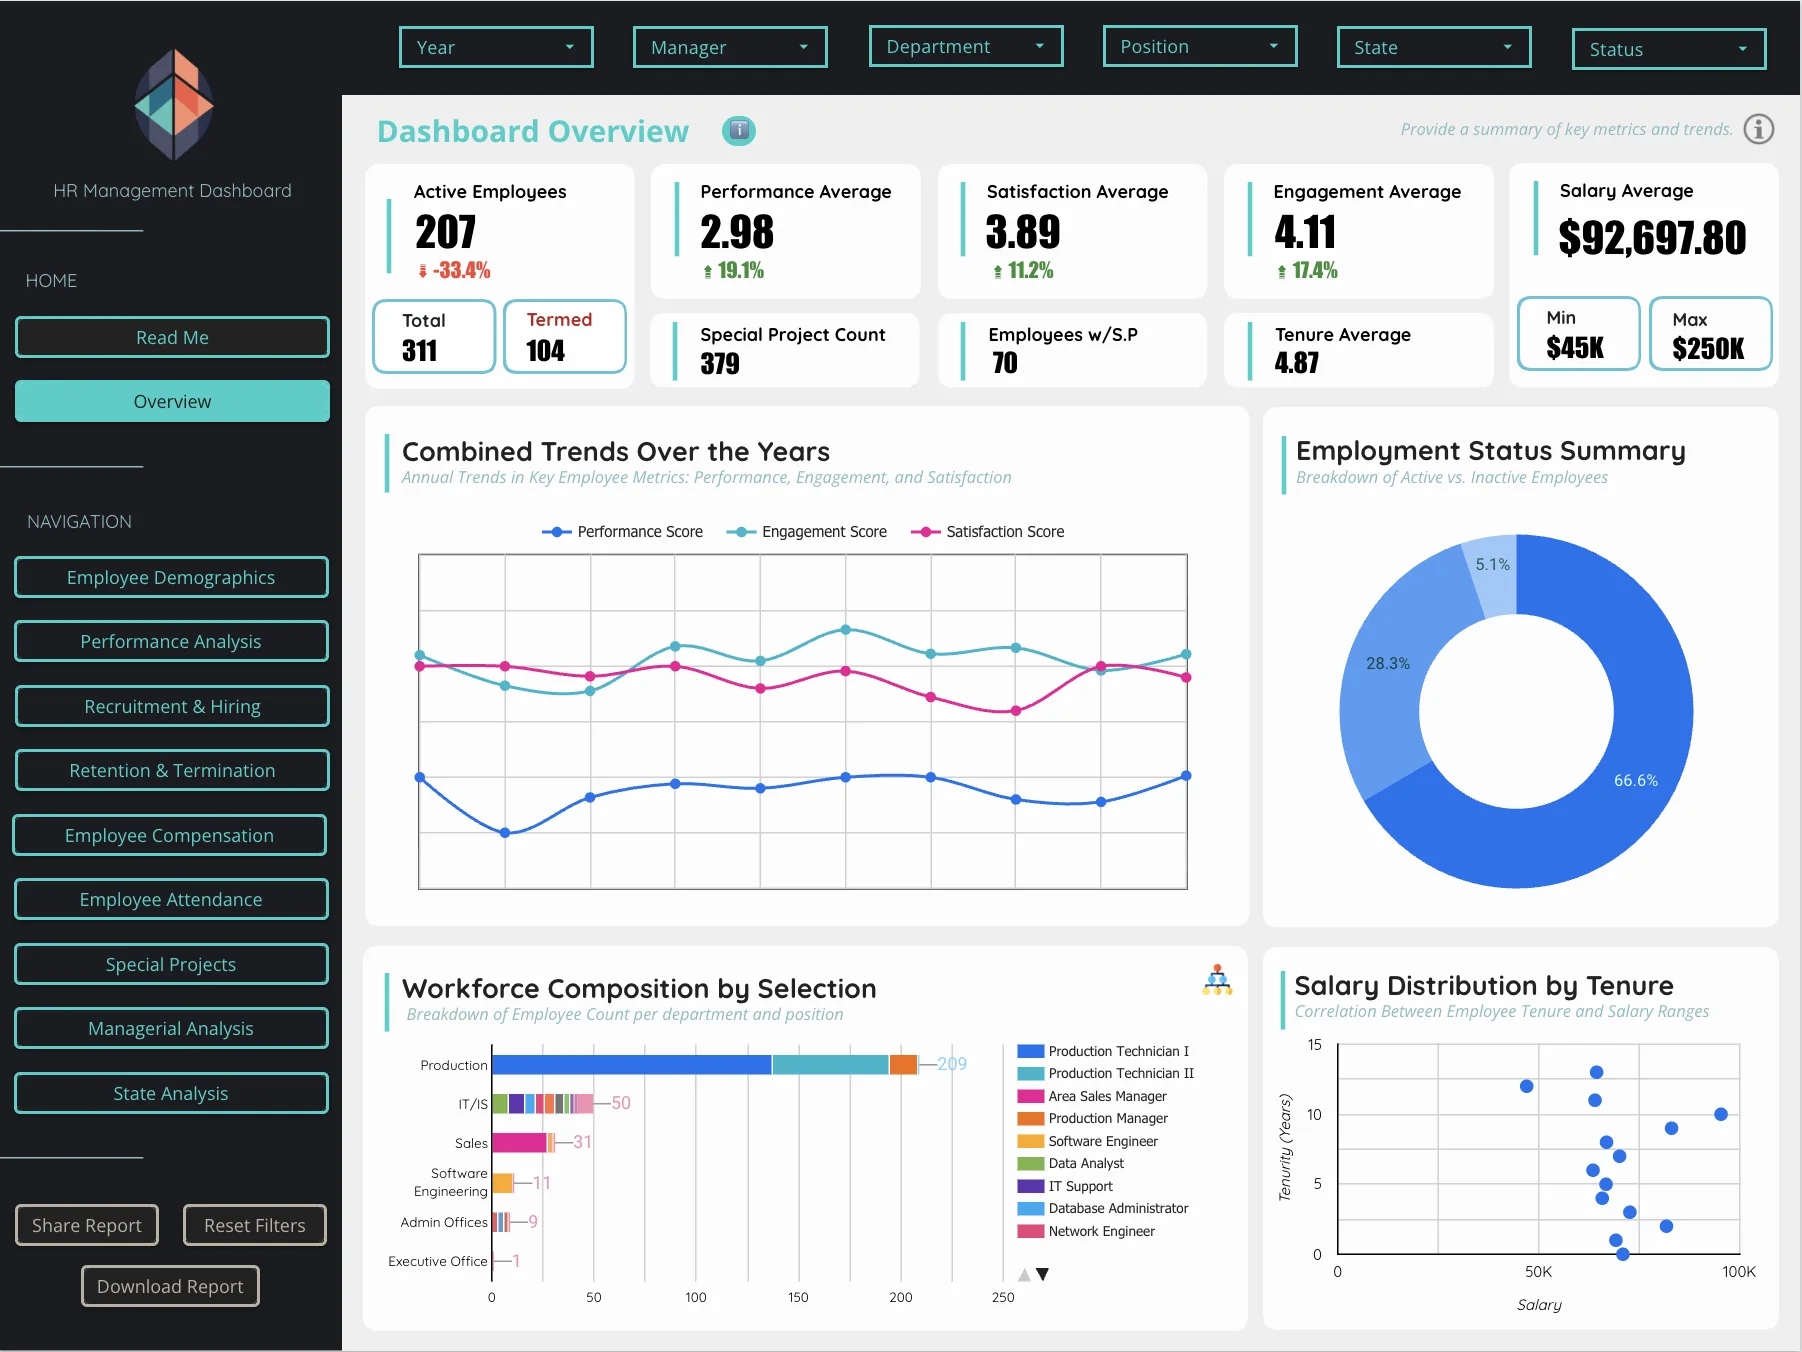
HR ANALYTICS · OVERVIEW
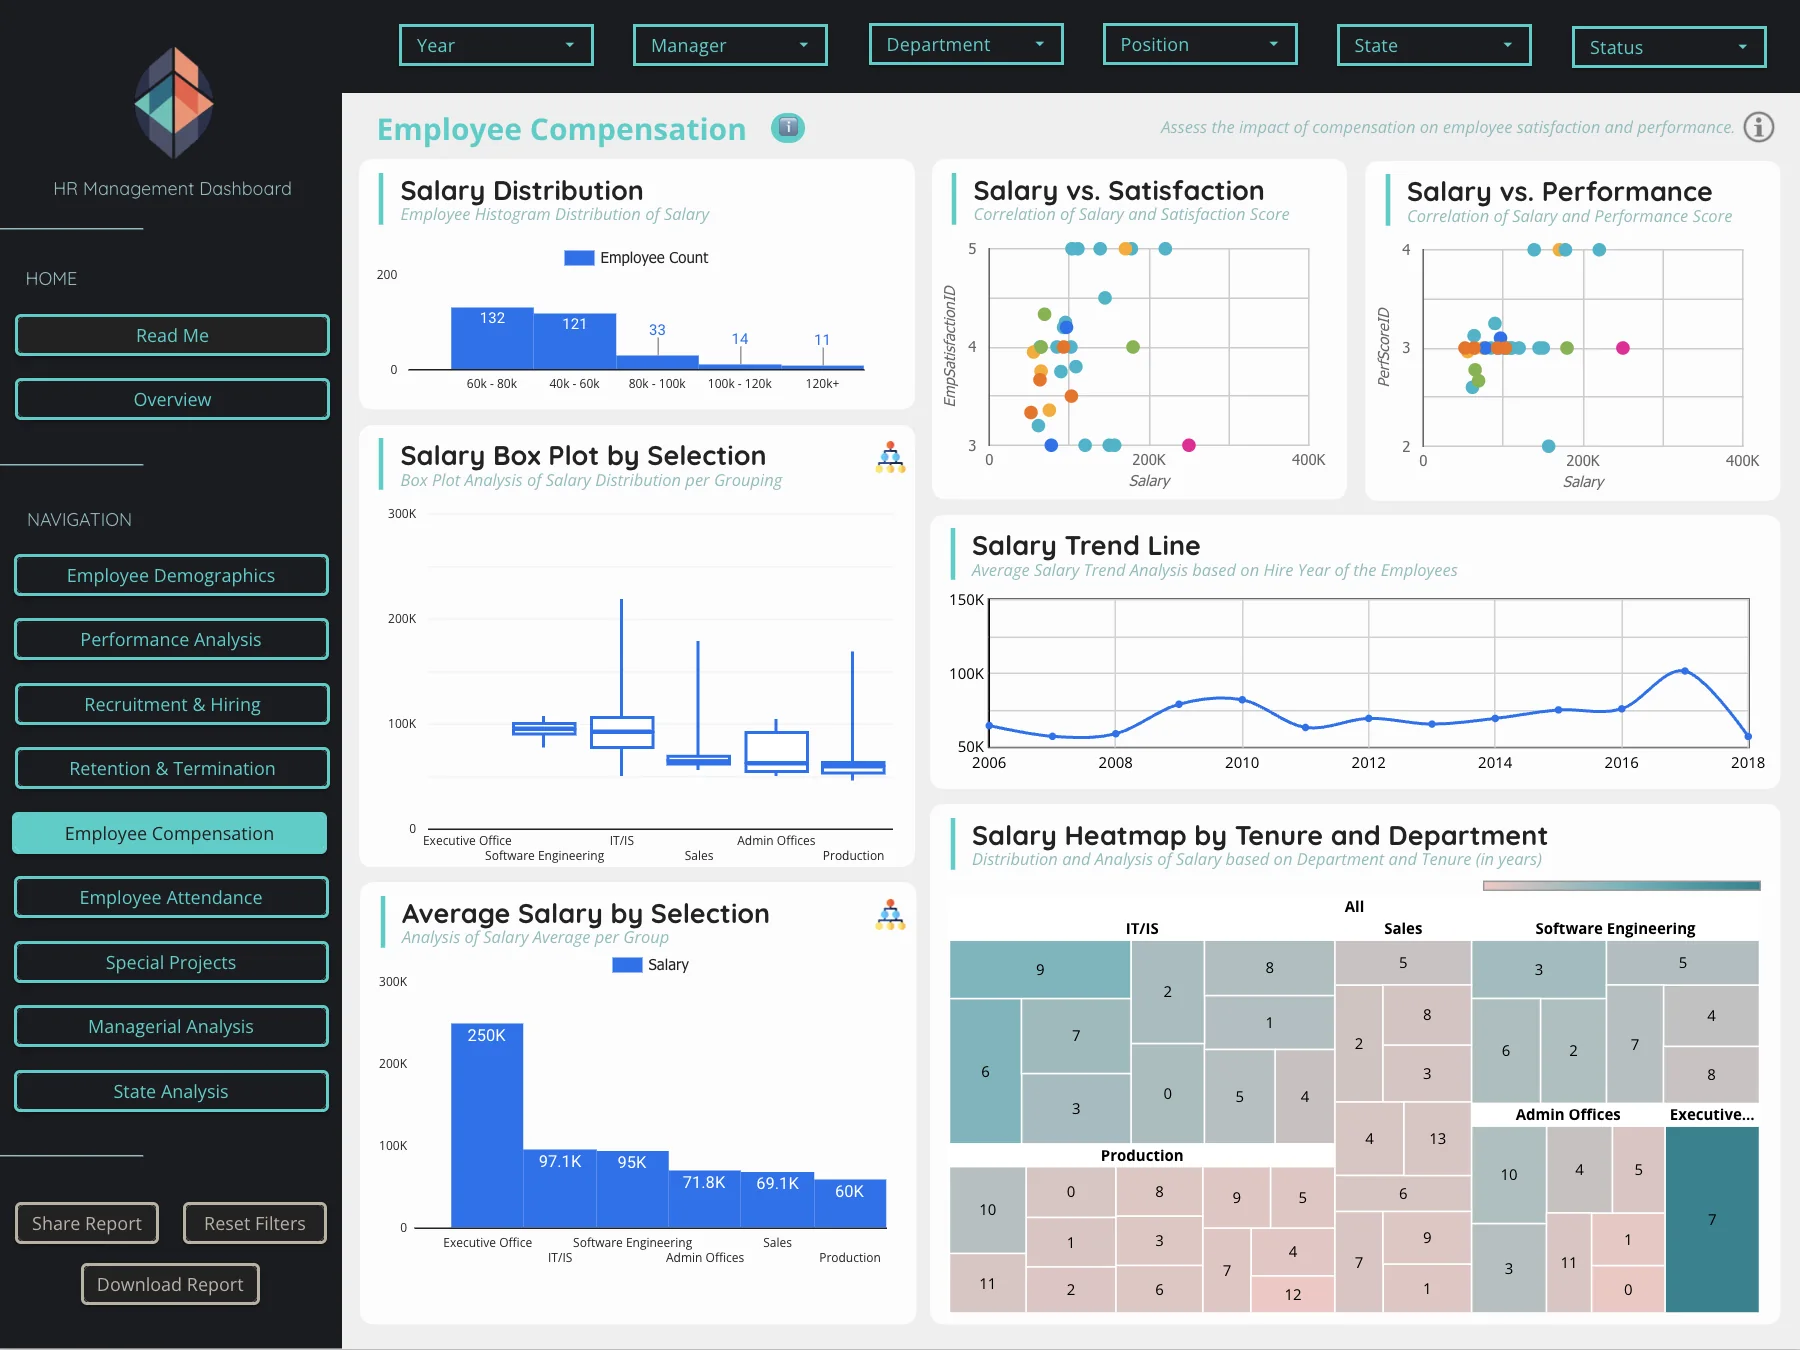
HR Management Analytics overview page in Looker Studio
COMPENSATION
Independent project · Public dataset

HR Management Analytics

An open-ended HR dataset of 311 records, structured into a ten-section analytics experience in Looker Studio.

What I build

Reporting that runs on its own, from data you already have

The data usually exists already. It’s spread across accounting, practice management, CRM and spreadsheets, and someone rebuilds the same reports by hand every month.

01
SCHEDULED REFRESH · NO REBUILDS

Management reporting automation

For reports someone rebuilds by hand every week or month.

Problem
The same reports rebuilt by hand, and out of date by the time they’re shared.
Outcome
Reports that refresh themselves on a schedule, so the team’s time goes into reading the numbers, not assembling them.
02
MANY SOURCES · SHARED DEFINITIONS

Data integration & dashboard consolidation

For data split across accounting, practice management, CRM and spreadsheets.

Problem
Each system answers part of the question, and the same metric means different things in different reports.
Outcome
A connected reporting architecture with reusable components and shared business definitions, so teams work from consistent numbers across reports.
03
LAYERED VIEW · ONE EXCEPTION

Operational & financial visibility

For managers who hear about problems too late.

Problem
Issues surface at month end, after the chance to act has passed.
Outcome
Performance against target, and the exceptions that need attention, visible while there’s still time to act.
How I work

From business question to management decision

My general approach runs through eight stages, adapted to each business and its data. The dashboard comes late, once the decision, the data and the definitions are settled.

?BUSINESS QUESTIONMANAGEMENT DECISION
All eight stages · select one to focus

The Approach page walks through the build stage by stage.

See the full approach
Principles

What good reporting should do

The standards every report I build is held to.

01

Business first

Start with the decision, not the dashboard.

02

Trust the data

Validate definitions, relationships, duplicates and source inconsistencies before presenting numbers.

03

Exceptions matter

Useful reporting helps identify what needs attention, not just describe what happened.

04

Automate the repeatable

If someone rebuilds the same report by hand every month, the process probably deserves a system.

About

The person behind the reports

Josh Javier

I’m Josh Javier, a business intelligence and reporting automation consultant. My work spans an accounting and advisory firm in Australia, a US company, and global fintech clients.

My background is in data operations and BI. At TaskUs I started as a Business Intelligence Analyst for global fintech clients and was promoted to Data Control & Client Launch Lead (Global), where I set up the data side of more than 25 new client launches and led the build of an automated KPI early-warning system.

For an Australian accounting and advisory firm I designed and delivered a 13-dashboard reporting system in three months, working with the client’s stakeholders from data integration through to delivery. I also work with Unite Us, in the United States, as a CRM & Marketing Data Specialist.

Outside of work I’m into design, photography, travel, fitness and good coffee. It shows in the work: I care as much about how a report reads as about what it calculates.
Works with
Teams in Australia and the United States, and global fintech clients
Experience
Unite Us (US): CRM & Marketing Data Specialist
TaskUs: Business Intelligence Analyst, then Data Control & Client Launch Lead (Global)
Recognition
TaskUs Top Analyst, Q4 2023
L’Oréal Brandstorm National Champion, 2022
Education
BS Business Administration, Technology Management, Enderun Colleges. Summa Cum Laude, Valedictorian
Contact

Let’s make your reporting work better.

Tell me what you’re working with and where the reporting takes too long. In a 20-minute call I’ll tell you what I’d look at first.